| Date |
July 11, 2019
|
|---|---|
| Content Type |
User Story
|
|
|
| Data Applications |
Climate & Weather
Ecosystem Monitoring
Water Quality
|
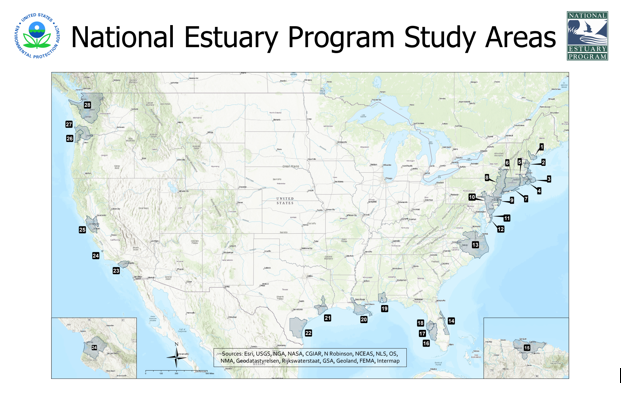
In 1987, Congress established the National Estuary Program (NEP) to identify, protect, and conserve water quality, ecologically significant estuaries, and surrounding watersheds. Currently, there are 28 estuaries in the National Estuary Program.
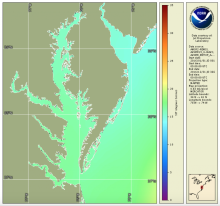
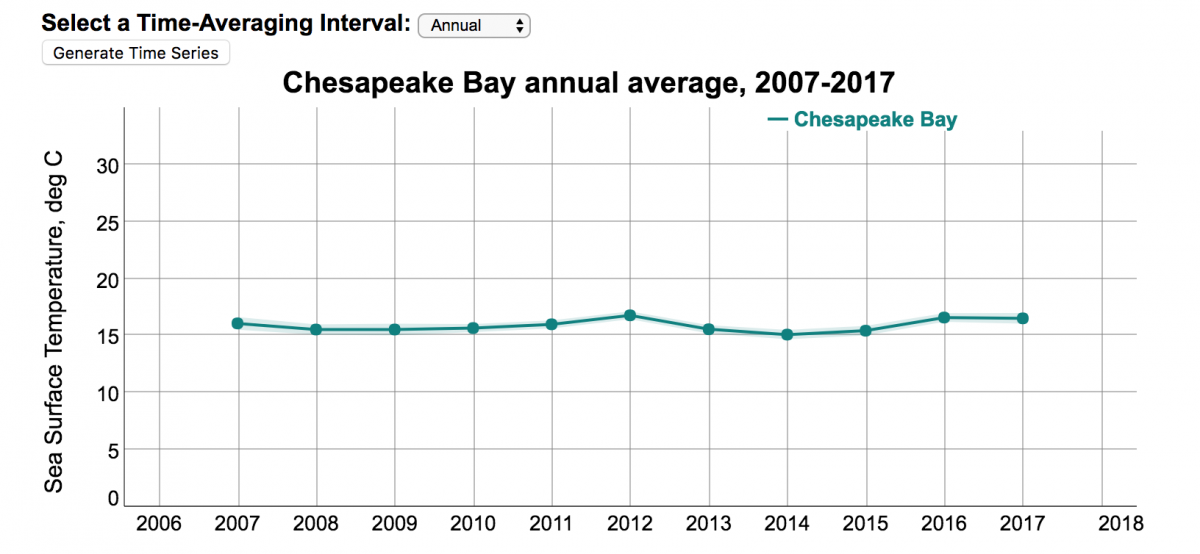
In response to a request from the EPA for temperature time series data, the NOAA CoastWatch East Coast Node began producing a Surface Sea Temperature (SST) time series product for estuaries located on the east coast. This product visualizes the monthly and annual average SST for each estuary in the region. Many estuaries do not have routine in situ temperature data collection, so satellite data fills a crucial information gap for estuarine managers.

The SST data provided by CoastWatch is used by estuarine managers in assessments of fisheries, seagrass, water quality, and recreational activity. This is particularly important as climate change affects the distribution of fish species, seagrasses, and the entire ecology of the estuaries. To further support the NEP, the NOAA CoastWatch East Coast node will be expanding their offering to include all estuaries in the NEP study area.