The NOAA Multi-Sensor Level-1 to Level-2 (MSL12) Ocean Color, science quality, multi-sensor global gap-filled analysis includes chlorophyll-a, Kd(490), and SPM products. These global gap-free data are generated using the data interpolating empirical orthogonal function (DINEOF) method (Liu and Wang, 2022). The data that go into this product currently come from 3 instruments: the Visible Infrared Imaging Radiometer Suite (VIIRS) sensor aboard the Suomi National Polar-orbiting Partnership (SNPP) satellite, VIIRS on the NOAA-20 satellite, plus the Ocean and Land Colour Instrument (OLCI) on the Sentinel 3A satellite from the Copernicus program of the European Union.
Data Access
Product Overview
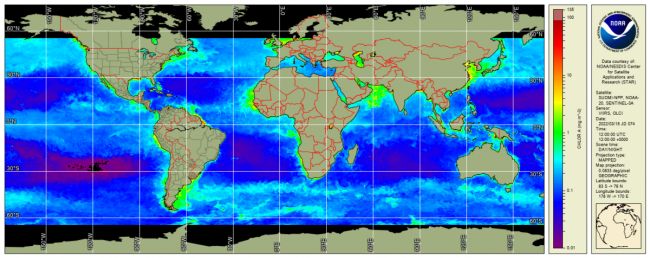
Ocean Color satellite sensors measure visible light, at specific wavelengths, that leaves the surface of the ocean and arrives at the top of the atmosphere where the sensor (satellite platform) is located. From these visible spectral radiance measurements, along with simultaneous radiance measurements at the near-infrared (NIR) and the shortwave infrared (SWIR) wavelengths, the color of the ocean, or normalized water-leaving radiances (nLw(λ)), can be calculated. Then, the nLw(λ) spectra are used to derive other ocean properties such as the concentration of chlorophyll-a (chlor-a or Chl-a) (Wang and Son, 2016), which is the green pigment responsible for photosynthesis and therefore an indicator of the amount of phytoplankton biomass in the ocean water, the diffuse attenuation coefficient at 490 nm Kd(490) (Wang et al., 2009), and water suspended particulate matter (SPM) (Wei et al., 2021). Kd(490) and SPM can be related to water turbidity and clarity.
The NOAA Multi-Sensor Level-1 to Level-2 (MSL12) Ocean Color, science quality, multi-sensor global gap-filled analysis includes chlorophyll-a, Kd(490), and SPM products. These global gap-free data are generated using the data interpolating empirical orthogonal function (DINEOF) method (Liu and Wang, 2022). The data that go into these three products currently come from 3 instruments: the Visible Infrared Imaging Radiometer Suite (VIIRS) sensor aboard the Suomi National Polar-orbiting Partnership (SNPP) satellite, VIIRS aboard the NOAA-20 satellite, plus the Ocean and Land Colour Instrument (OLCI) on the Sentinel 3A satellite from the Copernicus program of the European Union. NOAA gets the OLCI Level-1B data from EUMETSAT, and ocean color data at NOAA are processed using the same NOAA MSL12 ocean color data processing system developed by the NOAA/STAR Ocean Color Team (Wang et al., 2013).
Mikelsons and Wang (2019) explains the approach to the Level-3, multi-sensor merged, global daily data product served by CoastWatch at ~4 km spatial resolution in NetCDF format. SNPP and NOAA-20 operate along the same Sun-synchronous polar orbit that crosses the equator at about 13:30 local time—both satellites travel around Earth from pole to pole in such a way that they observe the same areas at about the same time of day, no matter the season. There is about a 50-minute delay between the paths of NOAA-20 and SNPP, so NOAA-20’s path runs between two adjacent SNPP orbital paths and vice versa. Thus, the overlap of the spatial coverages in the two VIIRS sensors automatically fills each instrument’s data gaps (Mikelsons and Wang, 2019). In addition, ocean color data from the VIIRS SNPP and NOAA-20 have the same spatial and temporal resolution, and these data are processed using the same algorithm and software package (i.e., MSL12). Therefore, the statistics of their ocean color products are very similar, and the data can be merged into a global 9-kilometer resolution data set directly without adjustment (Liu and Wang, 2019). These multi-sensor daily merged products are derived from MSL12 for VIIRS SNPP and NOAA-20, as well as OLCI-Sentinel-3A (Liu and Wang, 2022).
Note that proper adjustments are applied to Chl-a, Kd(490), and SPM algorithms so that consistent ocean biological and biogeochemical products can be derived from the three satellite sensors (VIIRS-SNPP, VIIRS-NOAA-20, and OLCI-Sentinel-3A) (Wang et al., 2020).
The EOS article by Liu and Wang (2019) explains the approach to the Level-4, multi-sensor, gap-filled analysis for the earlier, 2-sensor product (VIIRS SNPP plus VIIRS NOAA-20; also available on CoastWatch). "Even after the datasets from the two satellites are merged, some gaps remain. To complete the picture, the gap-filling application uses a mathematical technique based on the data interpolating empirical orthogonal function (DINEOF) (Alvera-Azcarate et al., 2005; Beckers and Rixen, 2003). This technique exploits the coherency over location and time of the data from the two satellites to infer a value at the missing location." CoastWatch now serves this 3-sensor-derived daily global gap-filled Chl-a, Kd(490), ans SPM products at 9 km spatial resolution in NetCDF. Go to the data access tab on this page for access.
Please read Liu and Wang (2022) for details about the global gap-free ocean color products of Chl-a, Kd(490), and SPM derived from multi-satellite measurements of VIIRS-SNPP, VIIRS-NOAA-20, and OLCI-Sentinel-3A.
Product Details
| Temporal Start Date |
February 9, 2018
|
|---|---|
| Temporal Coverage |
Daily |
| Product Families |
Ocean Color
|
| Measurements |
Chlorophyll-a Concentration
Diffuse Attenuation Coefficients
Suspended Particulate Matter
|
| Processing Levels |
Level 4
|
| Latency Groups |
24+ hours (Delayed)
|
| Latency Details |
Daily, ~24h to 48h |
| Spatial Resolution Groups |
2km+
|
| Spatial Resolution Details |
9km |
| Data Providers |
NOAA
NESDIS
STAR
CoastWatch
|
Spatial Coverage
Global
| Description |
180W - 180E |
|---|
Processing Algorithms
MSL12
| Description |
Multi-Sensor Level-1 to Level-2 (MSL12) Ocean Color Data Processing System |
|---|
Platforms
Instruments
OLCI
| Description |
Ocean and Land Colour Instrument |
|---|---|
| Platforms | |
| Instrument Types |
Imager
|
| Organizations |
ESA
|
Documentation
Liu, X. and M. Wang, "Global daily gap-free ocean color products from multi-satellite measurements", Int. J. Appl. Earth Obs. Geoinf., 108, 102714 (2022). doi:10.1016/j.jag.2022.102714
Wei, J., M. Wang, L. Jiang, X. Yu, K. Mikelsons, and F. Shen, "Global estimation of suspended particulate matter from satellite ocean color imagery", Journal of Geophysical Research: Oceans, 126, e2021JC017303 (2021). doi:10.1029/2021JC017303
Liu, X. and M. Wang, "Filling the gaps in ocean maps", EOS, 100 (2019). doi:10.1029/2019EO136548
Liu, X., and M. Wang (2019), Filling the gaps of missing data in the merged VIIRS SNPP/NOAA-20 ocean color product using the DINEOF method, Remote Sens., 11, 178, https://doi.org/10.3390/rs11020178.
Mikelsons, K., and M. Wang (2019), Optimal satellite orbit configuration for global ocean color product coverage, Opt. Express, 27, A445–A457, https://doi.org/10.1364/OE.27.00A445
Mikelsons, K., and M. Wang (2018), Interactive online maps make satellite ocean data accessible, Eos Trans. AGU, 99, https://doi.org/10.1029/2018EO096563.
Liu, X. and M. Wang, "Gap filling of missing data for VIIRS global ocean color product using the DINEOF method", IEEE Trans. Geosci. Remote Sens., 56, 4464-4476 (2018). doi:10.1109/TGRS.2018.2820423
Wang, M. and S. Son, "VIIRS-derived chlorophyll-a using the ocean color index method", Remote Sens. Environ., 182, 141-149 (2016). doi:10.1016/j.rse.2016.05.001
Wang, M., et al. (2013), Impact of VIIRS SDR performance on ocean color products, J. Geophys. Res. Atmos., 118, 10,347–10,360, https://doi.org/10.1002/jgrd.50793.
Wang, M., S. Son, and L. W. Harding Jr., “Retrieval of diffuse attenuation coefficient in the Chesapeake Bay and turbid ocean regions for satellite ocean color applications,” J. Geophys. Res., 114, C10011, https://doi.org/10.1029/2009JC005286, 2009.
Wang, M., L. Jiang, S. Son, X. Liu, and K. J. Voss, “Deriving consistent ocean biological and biogeochemical products from multiple satellite ocean color sensors,” Opt. Express, 28, 2661–2682, 2020. https://doi.org/10.1364/OE.376238
Alvera-Azcarate, A., et al. (2005), Reconstruction of incomplete oceanographic data sets using empirical orthogonal functions: Application to the Adriatic Sea, Ocean Model., 9, 325–346, https://doi.org/10.1016/j.ocemod.2004.08.001.
Beckers, J., and M. Rixen (2003), EOF calculations and data filling from incomplete oceanographic data sets, J. Atmos. Oceanic Technol., 20, 1,839–1,856, https://doi.org/10.1175/1520-0426(2003)020<1839:ECADFF>2.0.CO;2.
Algorithm Theoretical Basis Document (ATBD)
Wang, M., X. Liu, L. Jiang and S. Son, "The VIIRS Ocean Color Products", Algorithm Theoretical Basis Document Version 1.0, 68 pp., June 2017.
For more MSL12 processing documentation, please go to documentation tab here.